Plotting a line chart with Rust's GTK+3 bindings
Since I discovered that there was bindings of GTK+3 in Rust I got excited to build something with it. After looking some examples, I thought it would be fun to build a line chart plotter. I ended up learning a lot, so I'll guide you in this post how to plot a very basic line chart using GTK and Cairo.
Requirements
First things first.
Make sure you have GTK+3 installed, chances are that if you're in a linux distro with GNOME you're already good to go and don't need to do anything. I didn't test this tutorial at Windows or MacOS, but theoretically it should work.
Let's get started
We'll need to use gtk, gio, and cairo (the graphics library) crates in this project, so edit your cargo.toml file adding these dependencies:
[dependencies]gio = "^0"gtk = "^0"cairo-rs = "^0"Now with the setup done, let's create and run our GTK application that will hold the graphics. The draw function will handle the drawing of the chart and it receives the app, the x and y axis as parameters.
use gio::prelude::*;use gtk::prelude::*;use std::env::args;
fn draw(app: >k::Application, x_axis: Vec<i32>, y_axis: Vec<i32>) { // some code here}
fn main() { // Initilize the application with the default config let application = gtk::Application::new(Some("com.andrei.gtk-line-chart"), Default::default()) .expect("Initialization failed...");
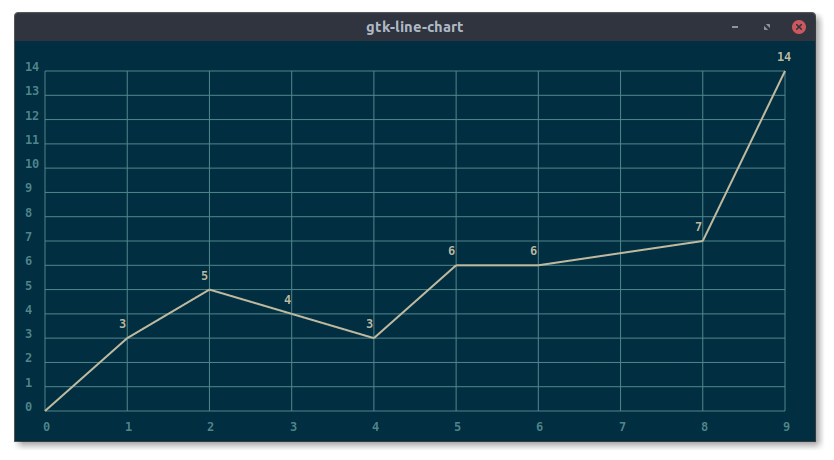
// The data axis we'll plot a line chart let x_axis = vec![0, 1, 2, 3, 4, 5, 6, 8, 9]; let y_axis = vec![0, 3, 5, 4, 3, 6, 6, 7, 14];
application.connect_activate(move |app| { draw(app, x_axis.clone(), y_axis.clone()); });
application.run(&args().collect::<Vec<_>>());}So now we have our application, but we need two things to start drawing our chart: some Window and a DrawingArea inside of it. For the sake of simplicity we'll set a fixed 800x400 size for the window, and the drawing area will have a 30px padding of the window size. So here's the code inside the draw function:
let window = gtk::ApplicationWindow::new(app);let drawing_area = Box::new(DrawingArea::new)();let size = (800.0, 400.0);let padding = 30.0;let chart_area: (f64, f64) = (size.0 - padding * 2.0, size.1 - padding * 2.0);
drawing_area.connect_draw(move |_, cr| { // Here we draw using the given Context Inhibit(false)});
window.set_default_size(size.0 as i32, size.1 as i32);
window.add(&drawing_area);window.show_all();The connect_draw closure receives the cairo's Context as parameter (cr), that's the variable we'll use to draw the lines and labels, it's pretty much just like any other canvas. So let's set the background, the font and line width.
cr.set_source_rgb(1.0 / 255.0, 46.0 / 255.0, 64.0 / 255.0); // Background colorcr.paint();
// Set a monospace fontcr.select_font_face("monospace", FontSlant::Normal, FontWeight::Bold);cr.set_font_size(12.0);cr.set_line_width(1.0);Before plotting our line chart we need to normalize our data, this code below basically finds every relative point in the charting area for every data point of our data:
let max_x = x_axis.iter().max().unwrap();let max_y = y_axis.iter().max().unwrap();let size_x = chart_area.0 / *max_x as f64;let size_y = chart_area.1 / *max_y as f64;
let data_points = x_axis.iter().zip(y_axis.iter());let normalized_data: Vec<(f64, f64, f64)> = data_points .map(|(x, y)| { ( padding + size_x * *x as f64, padding + chart_area.1 - size_y * *y as f64, *y as f64, ) }) .collect();Now we can start drawing the grid and its labels:
cr.set_source_rgb(79.0 / 255.0, 134.0 / 255.0, 140.0 / 255.0); // Set the grid lines color
for y_grid_line in 0..=(*max_y as i32) { let y_line = y_grid_line as f64 * size_y + padding; cr.move_to(padding, y_line); cr.line_to(size.0 - padding, y_line); cr.stroke();
cr.move_to(padding / 3.0, y_line); cr.show_text((max_y - y_grid_line).to_string().as_ref());}
for x_grid_line in 0..=(*max_x as i32) { let x_line = x_grid_line as f64 * size_x + padding; cr.move_to(x_line, padding); cr.line_to(x_line, size.1 - padding); cr.stroke();
cr.line_to(x_line - 2.0, size.1 - padding / 3.0); cr.show_text(x_grid_line.to_string().as_ref());}And finally, we draw the line iterating the data we a window of two, source and target. We're also priting the label of the y axis above every data point:
cr.set_line_width(2.0);cr.set_source_rgb(191.0 / 255.0, 186.0 / 255.0, 159.0 / 255.0); // Chart line/label color
let data_window = normalized_data.windows(2);for points in data_window { let source = points[0]; let target = points[1];
// Draw the line cr.move_to(source.0, source.1); cr.line_to(target.0, target.1); cr.stroke();
// Draw the label cr.move_to(target.0 - 8.0, target.1 - 10.0); cr.show_text(target.2.to_string().as_ref());}
Inhibit(false)Awesome, now just run cargo run and you'll be gifted with this beauty:
Conclusion
Playing with GTK bindings in Rust is super simple and straightforward. It's exciting that developers now can build complex GUI interfaces with the power of GTK and the speed and correctness of the Rust programming language.